

Deep Dive: All the Ranking Metrics for Recommender Systems Explained!
Machine Learning System Design

Recommender systems are usually a set of Machine Learning models that rank items and recommend them to users. We tend to care primarily about the top ranked items, the rest being less critical. If we want to assess the quality of a specific recommendation, typical ML metrics may be less relevant. We present here a set of metrics commonly used to measure recommender system performance. We look at the following metrics:
The hit rate
Precision and recall
The average precision (AP@N) and recall at N (AR@N)
The mean average precision (mAP@N) and the mean average recall at N (mAR@N)
The cumulative gains (CG)
The discounted cumulative gains (DCG)
The normalized discounted cumulative gains (NDCG)
The Kendall rank correlation coefficient
Average reciprocal hit rate

Hit rate
In many cases, the window size matters when we recommend many items. For example on Netflix, we get recommended movies and the most important recommended movies are the ones we can see at first glance. One could argue that the order does not matter as long as the relevant movies belong to the visible window.
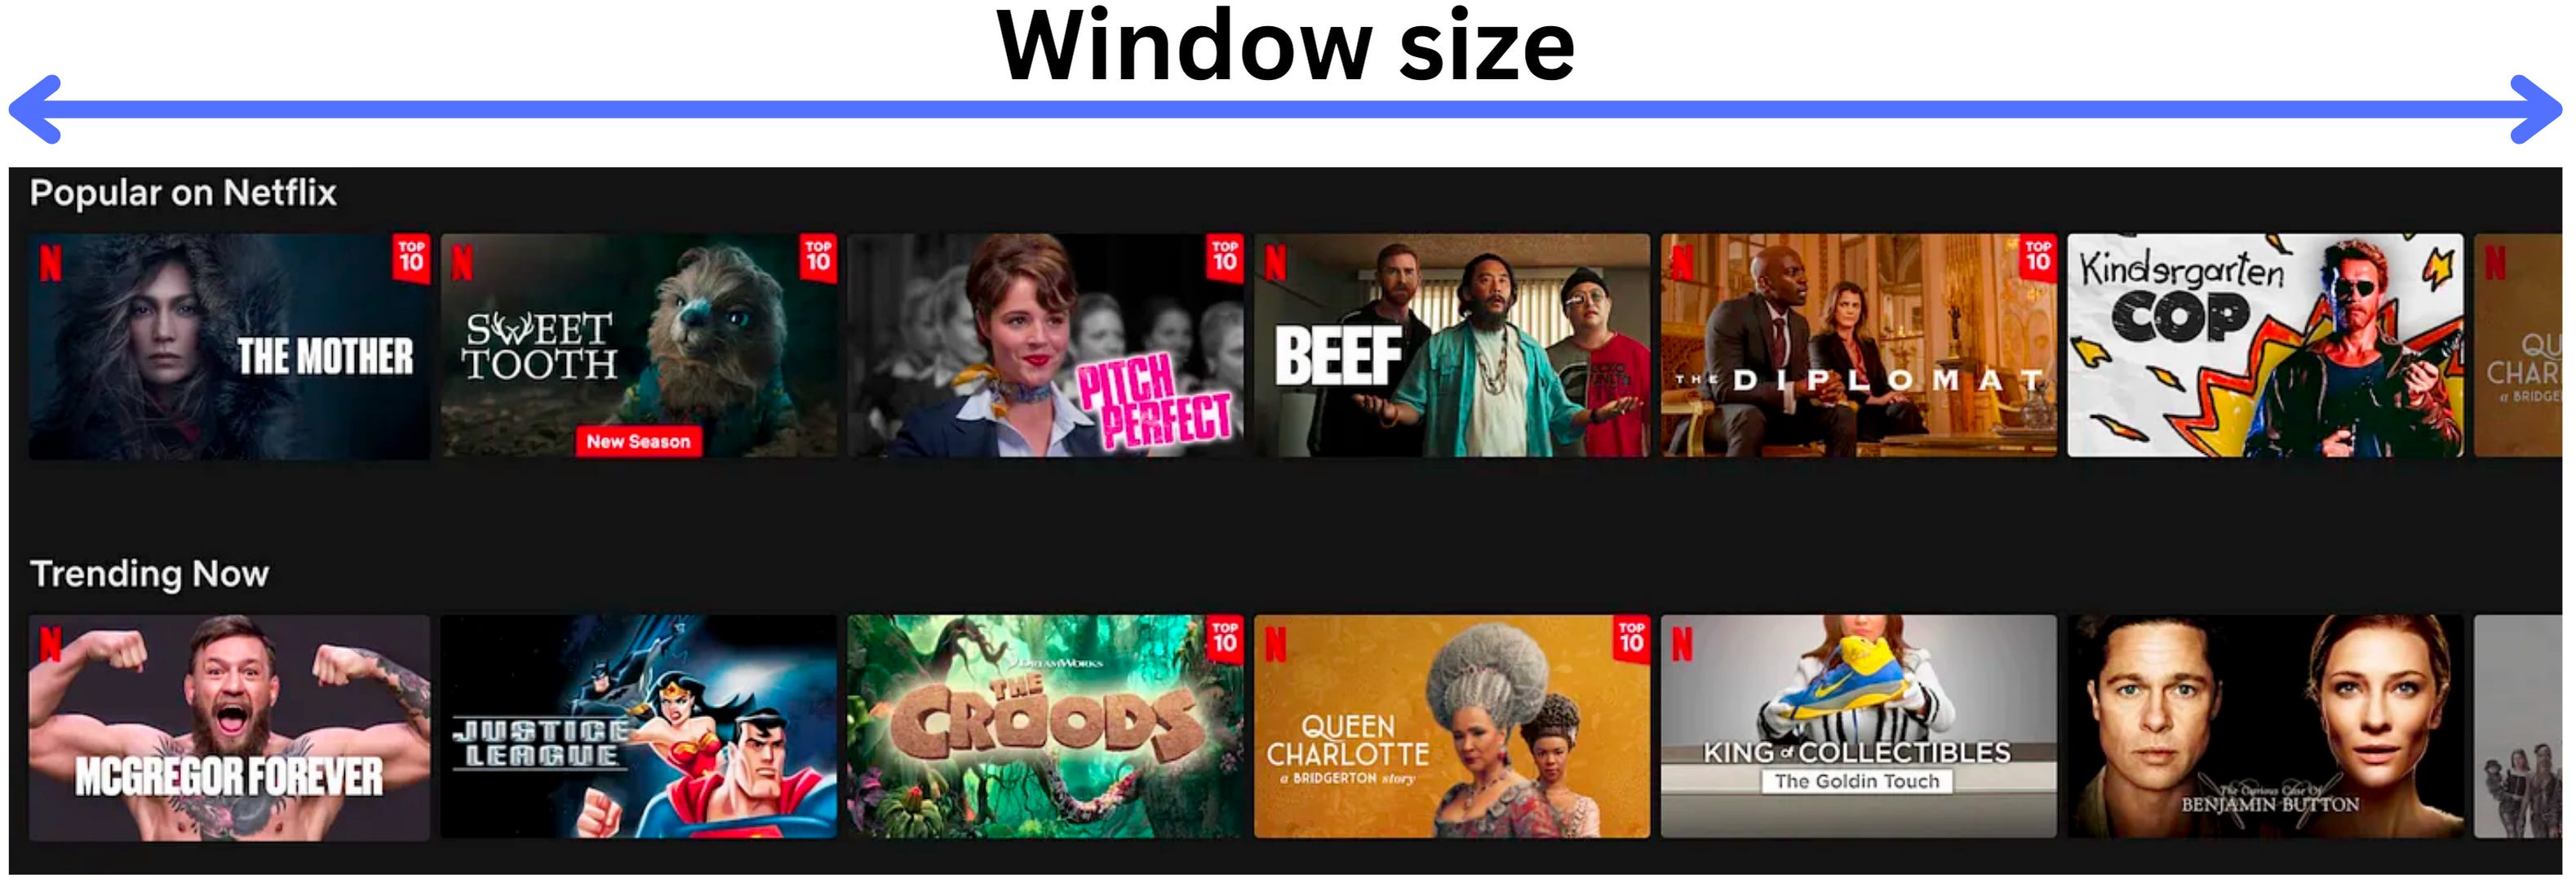
So the important question becomes:
Out of the recommended lists, how many users watched a movie in that visible window?
We measure this with the hit rate or hit ratio. Formally, if we present different personalized recommended lists to N users but only M users watch a movie out of a specific window size L, the hit rate is
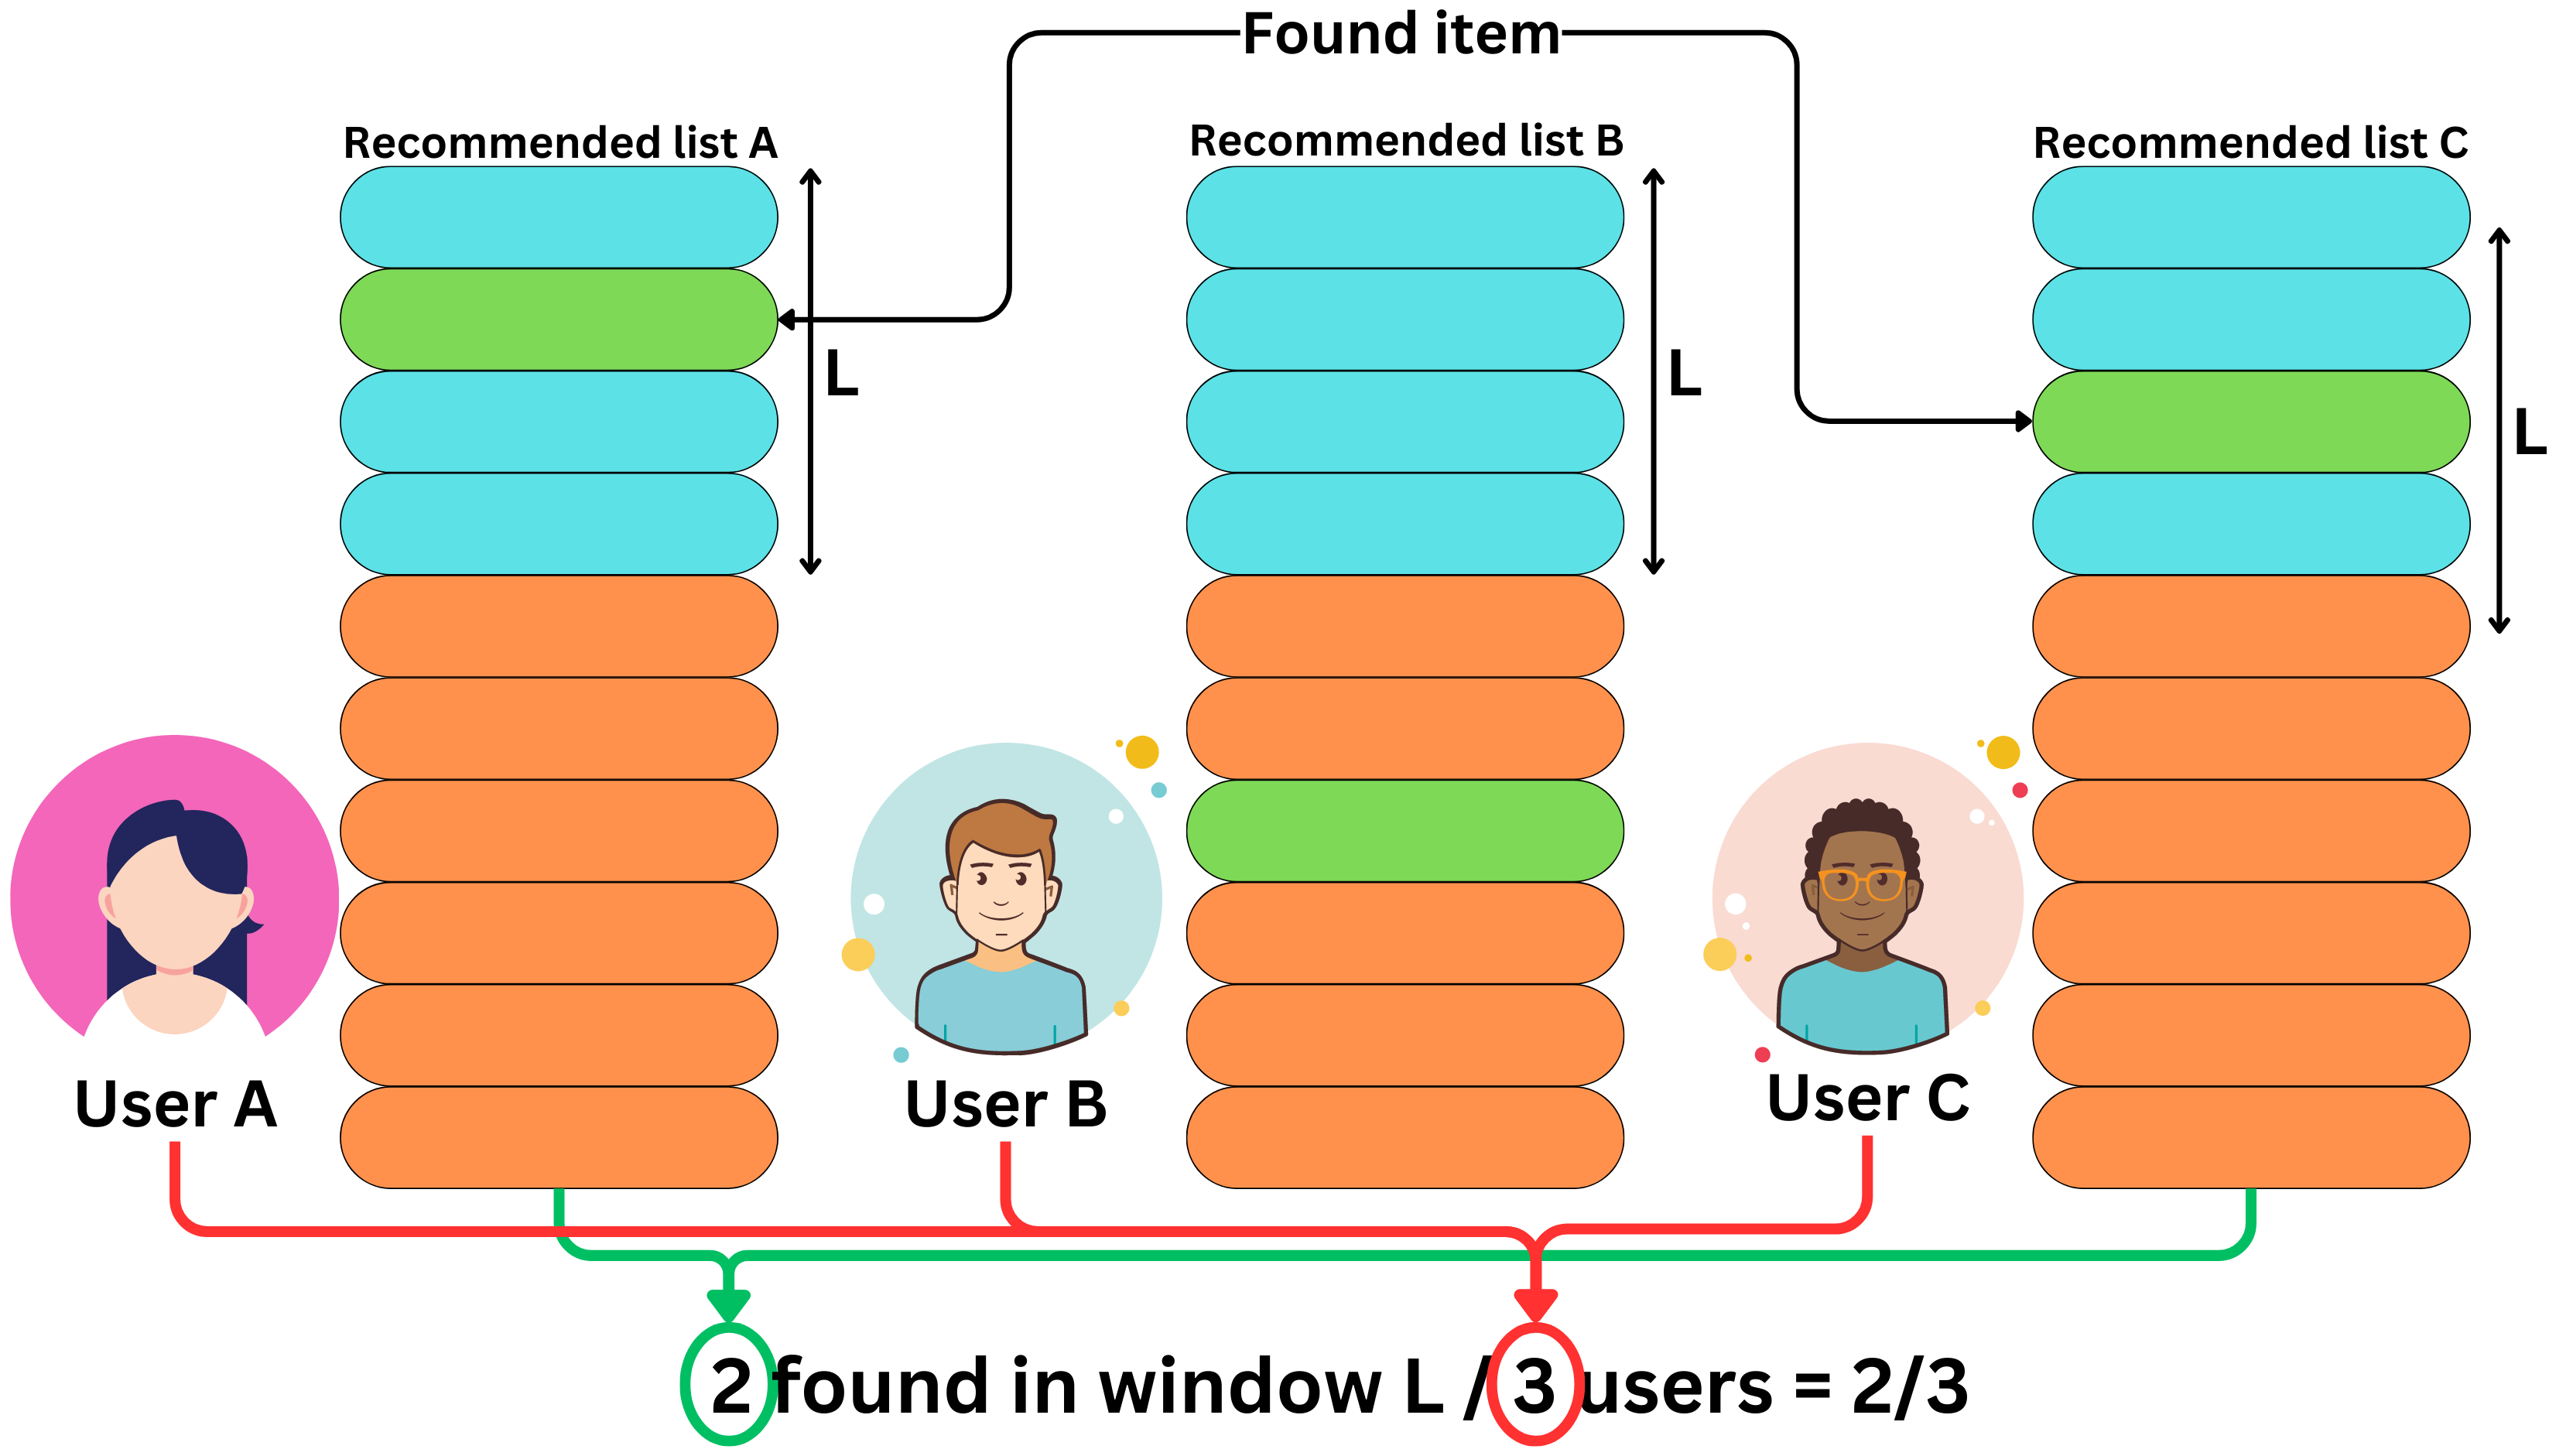
L is defined by the product's business requirements. In the case of Netflix movie recommendations, there can be multiple relevant windows. We can imagine the visible window is the first relevant one and the second could be the size of the carousel menu.
Mean Average Precision and Mean Average Recall at N (mAP@N and mAR@N)
Instead of considering multiple windows, we could consider all possible windows. That could be helpful if the size of the visible window changes depending on the device it is being watched on. For example if you open Youtube, you will see at the top, various numbers of videos, depending on the resolution of the monitor or the device (laptop, Android, iPhone).

As much as possible we want the most relevant videos to be at the top so we need to penalize the metrics if they are too far down the list. Let’s look at the Mean Average Precision and Mean Average Recall at N (mAP@N and mAR@N) metrics to assess recommenders.
Precision
Precision is a natural metric to measure the relevance of a recommendation. The question that precision answers:
Out of the recommended videos, how many are relevant?
Formally if we recommend N videos and there are r videos that the user will click on, we define precision as

Recall
Recall is another natural metric to consider. The question that recall answers is
Out of the possible relevant videos, how many are we recommending?
Formally if there exist R relevant videos and if the user clicks on r of those within the recommended list, we define recall as

Typically, for binary classification problems we expect to balance precision and recall. The F1 score is for example a metric that captures that balance:
It is the harmonic mean of precision and recall metrics. It is not such a valid metric for recommender systems. For good classifiers, if we reduce the number N of recommended items, the precision increase and the recall decrease. This is because the classifier is going to be more confident about the items at the top of the list and the density of relevant items will increase. Similarly, when we increase N, precision decreases and recall increases. This is because we include more and more relevant items but also more irrelevant items at a higher rate.
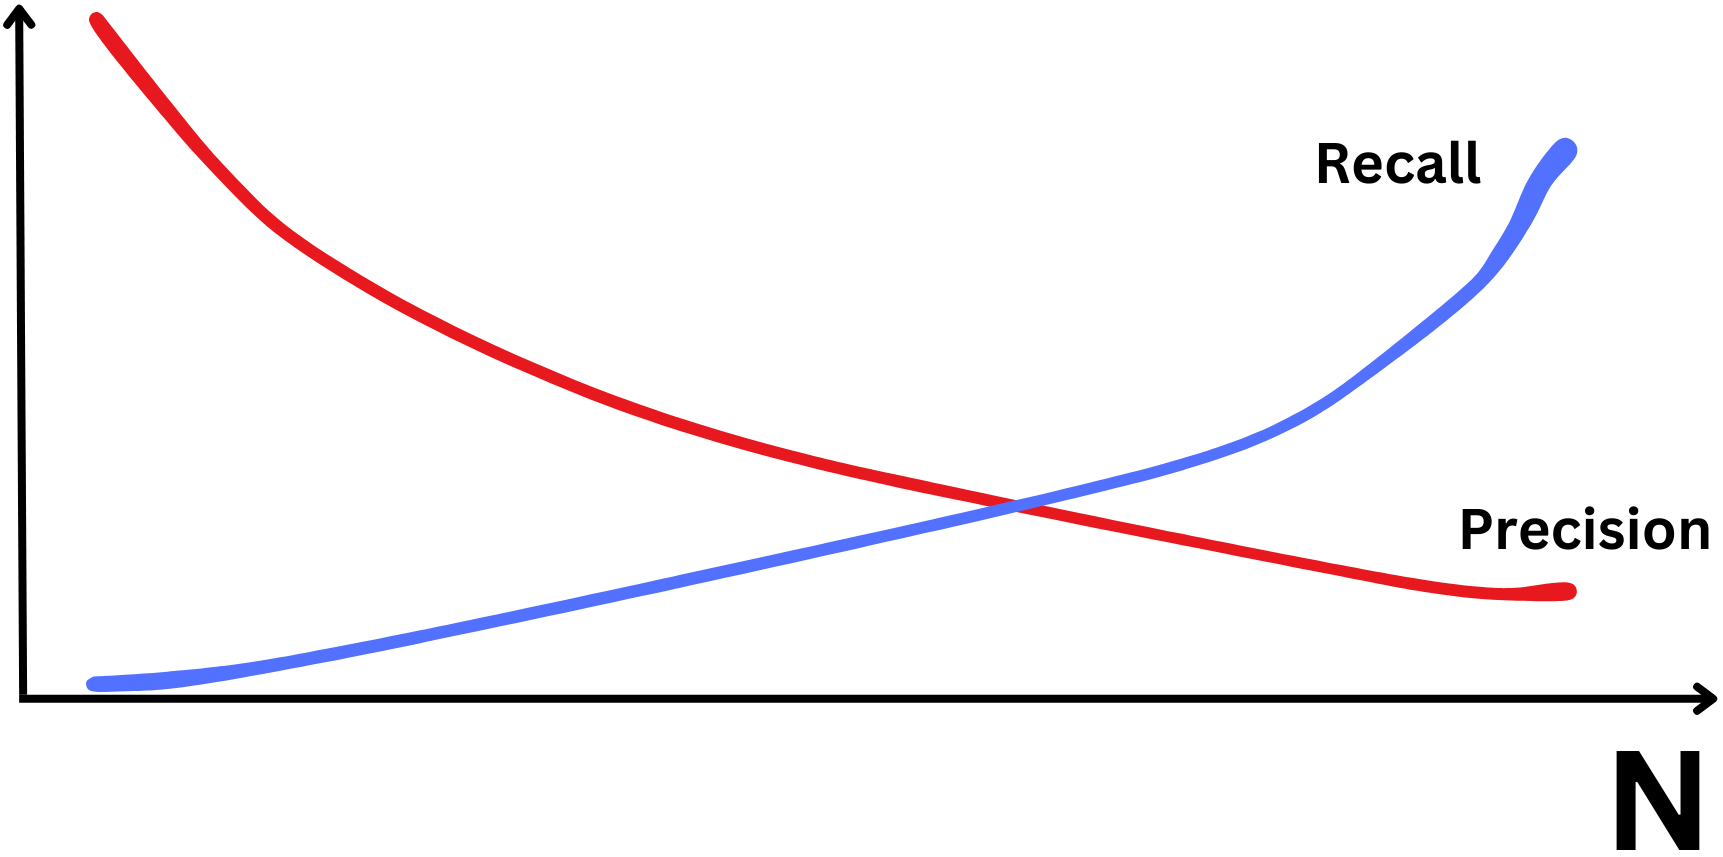
In recommender systems, it doesn’t matter if we include all the relevant items as long as at least one relevant item belongs to the list. That is why we tend to optimize more for precision than recall for those use cases.
Average Precision at N (AP@N)
Precision and recall do not take into account how far down the list the relevant items may be. The average precision metric is a way to account for this. It asks the question
What is the average precision for any window size?
We still consider a maximum window size N, but we consider all the window sizes k within it where there is a relevant item:
We only include the precision in the sum if the item is relevant for that window size:

We average those precisions and normalize by the number of relevant videos

Average Recall at N (AR@N)
The average recall is very similar but we use recall as the metric to average (duh!)
What is the average recall for any window size?
Formally we have
We only include the recall in the sum if the item is relevant at that point:

We average those recalls and normalize by the number of relevant videos

mAP@N and mAR@N
When it comes to the Mean Average Precision metric, “average“ refers to the average across the different window sizes and “mean“ refers to the average across all the users the recommender presented a recommendation to. Formally
and
Normalized Discounted Cumulative Gain
The problem with the metrics presented up to now is that all the relevant items are considered to have the same level of relevance. Even if all the recommended items are relevant, some may be more relevant than others. Let’s take the search results of a Google search query for example:

All the results are somewhat relevant but we need to make sure that the most relevant items are at the top of the list. To capture the level of relevance, it is common to hire human labelers to rate the search results
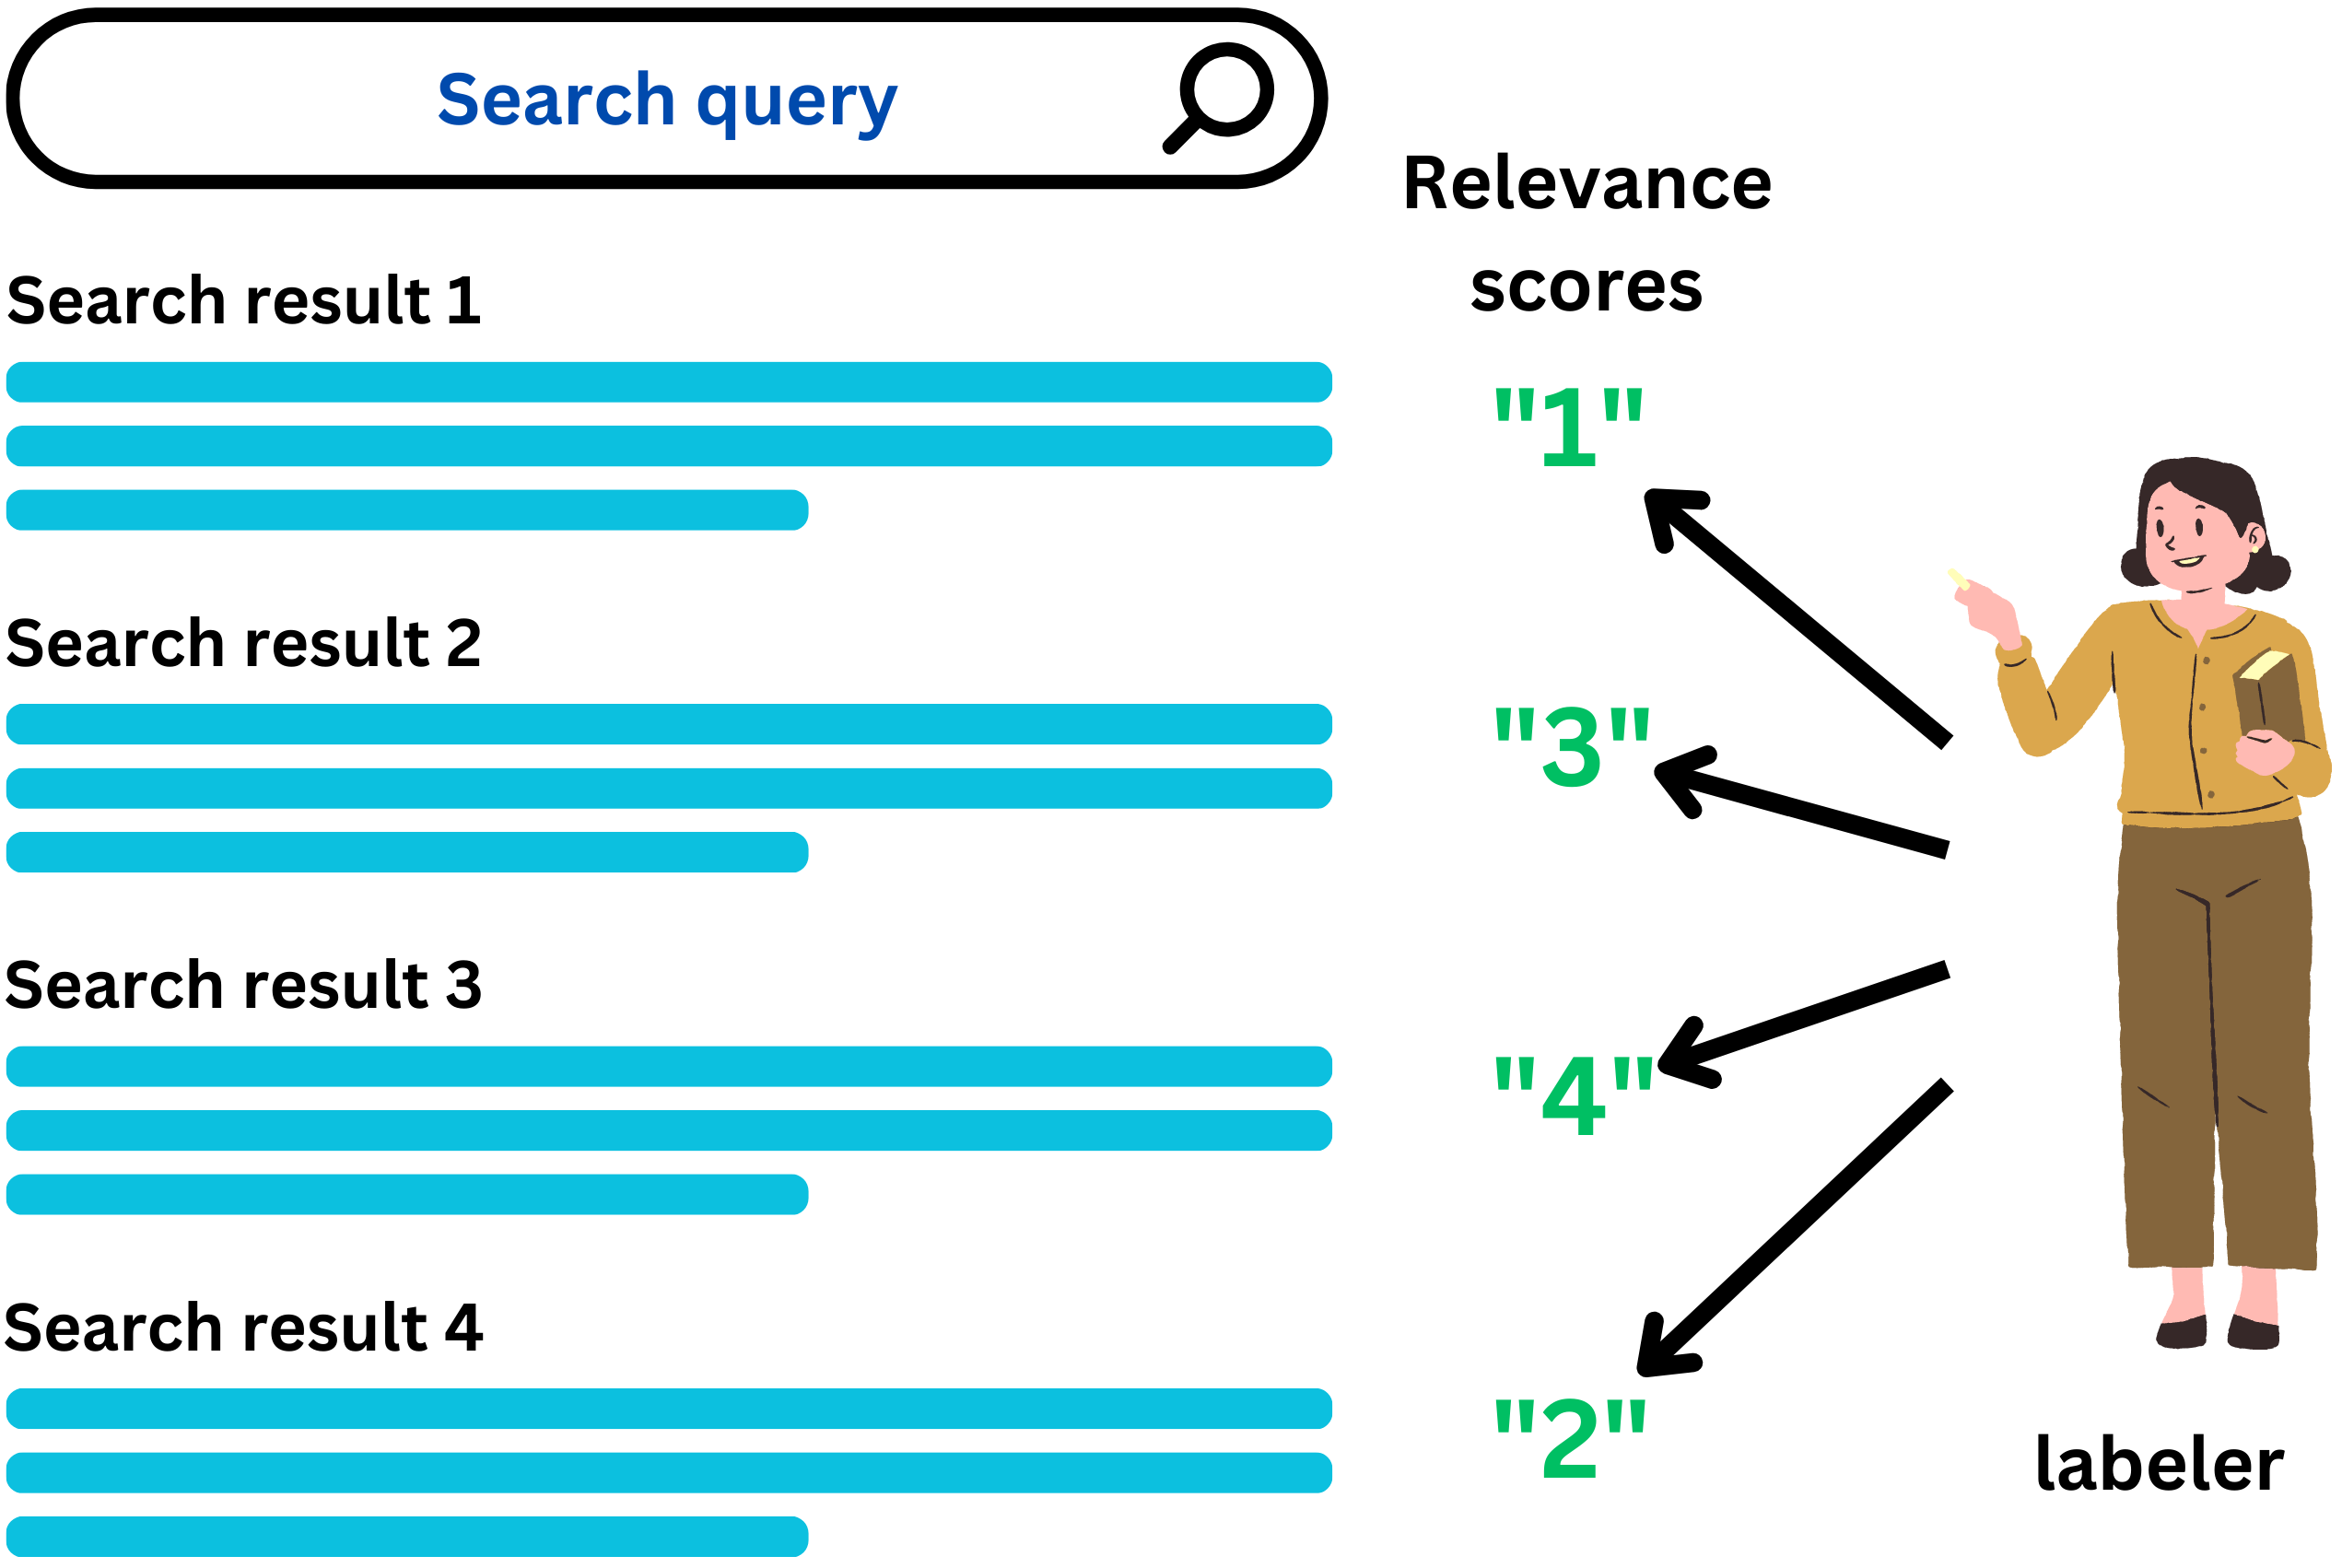
It is a very expensive process and can be quite subjective since it involves humans. For example we know that Google performed 757,583 search quality tests in 2021 using human raters: “Improving Search with rigorous testing“. Normalized discounted cumulative gain is a common metric to exploit relevance measured on a continuous spectrum. Let’s break that metric down.
Cumulative gain (CG)
Using the relevance labels we can compute diverse metrics to measure the quality of the recommendation. The cumulative gain (CG) metric answers the question
How much relevance is contained in the recommended list?
To get a quantitative answer to that question, we simply add the relevance scores provided by the labeler. We need to make sure we have cut off window size N to avoid adding an infinite number of elements:

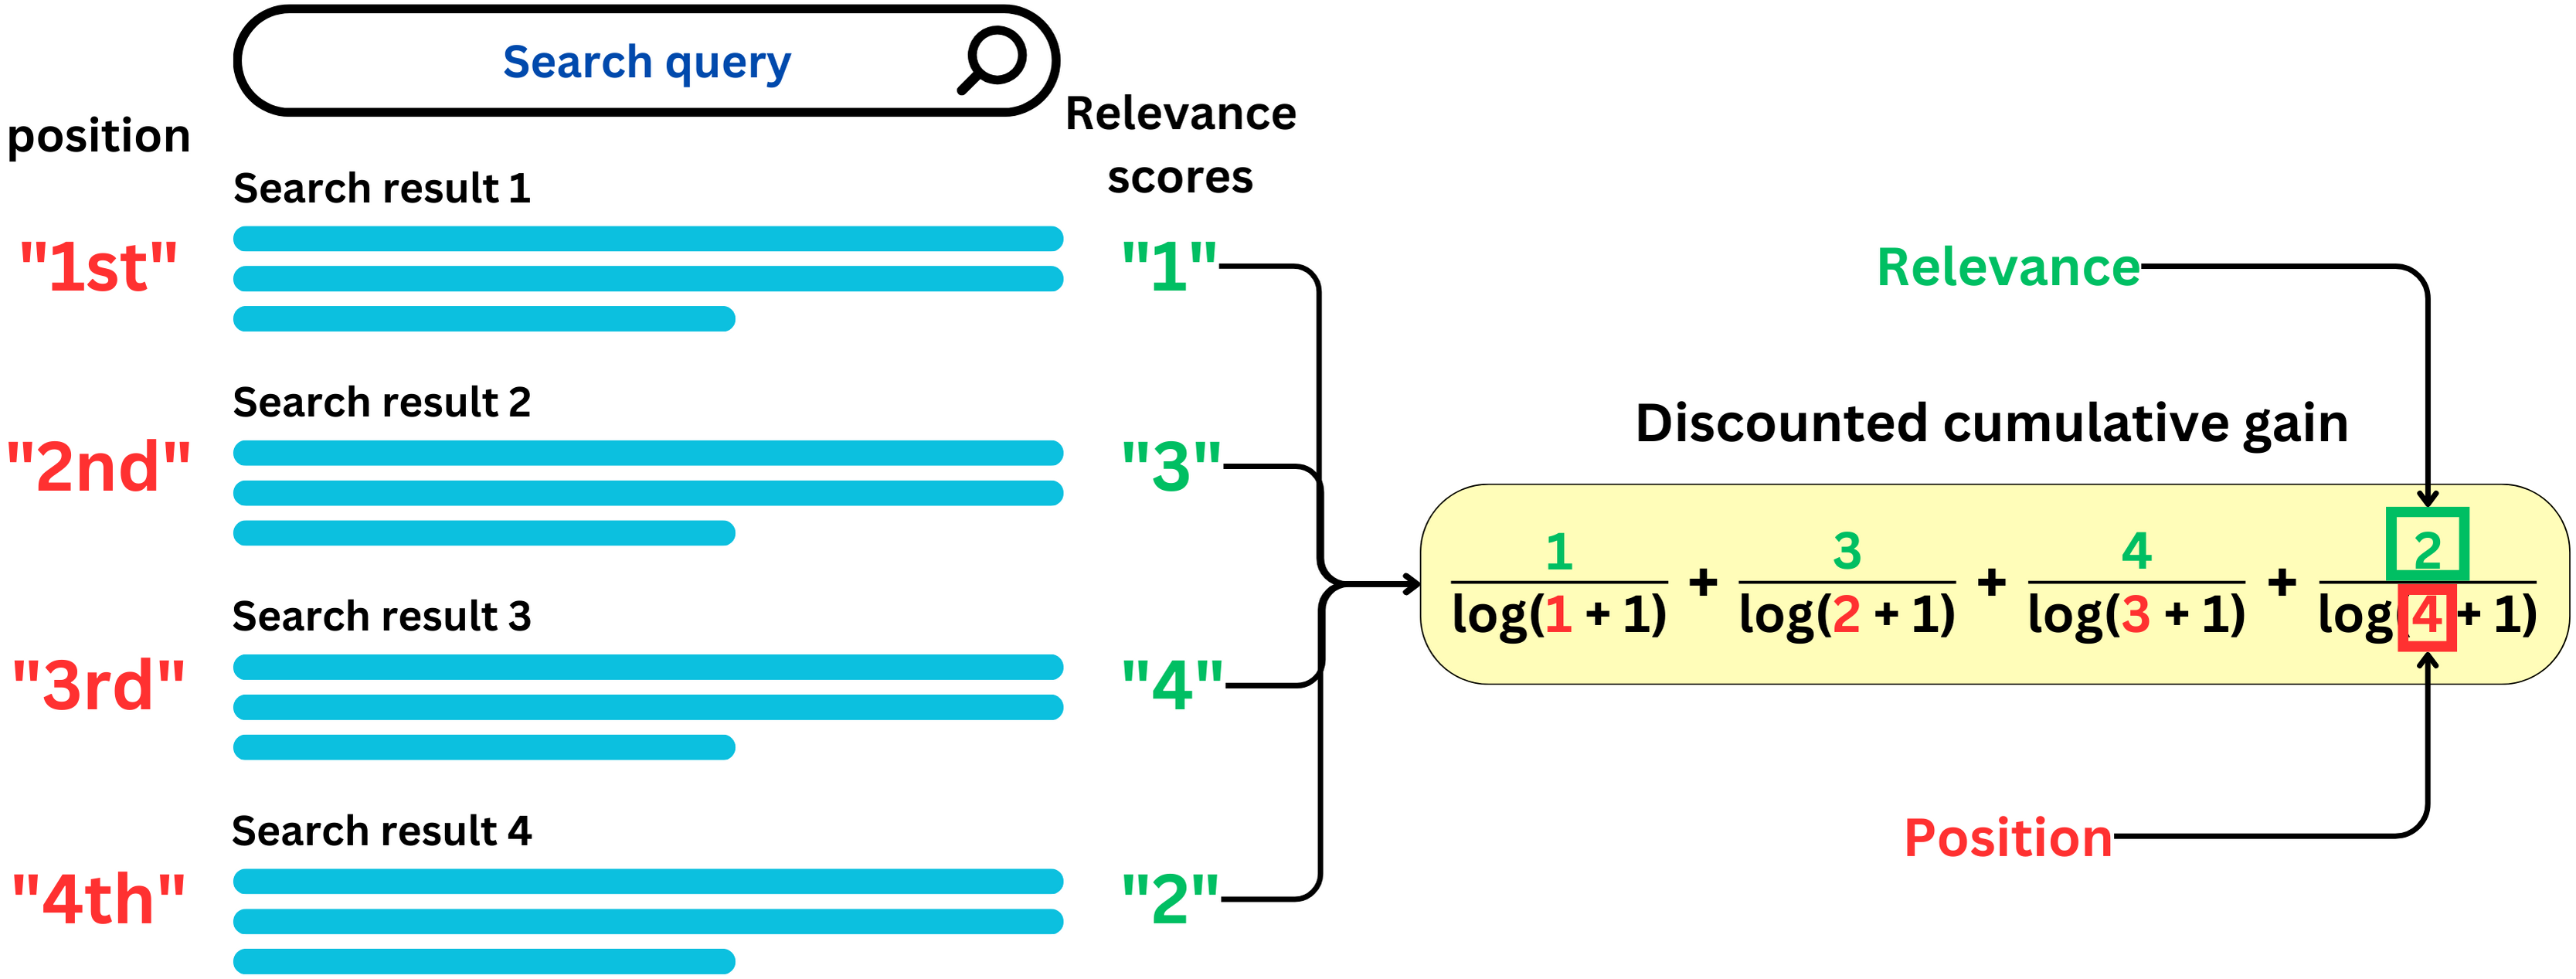
Discounted cumulative gain (DCG)
The problem with cumulative gain is that it doesn’t take into account the position of the search results. Any order would give the same value, however we want the most relevant items at the top. Discounted cumulative gain (DCG) discounts relevance scores based on their position in the list. The discount is usually done with a log function but other monotonic functions could be used:
Normalized discounted cumulative gain
DCG is quite dependent on the specific values used to describe relevance. Even with strict guidelines, some labelers may use high numbers and others low numbers. To put those different DCG values on the same level, we normalize them by the highest value DCG can take. The highest value correspond to the ideal ordering of the recommended items. We call the DCG for the ideal ordering the Ideal discounted cumulative gain (IDCG)
The Normalized discounted cumulative gain is the normalized DCG

If the relevance scores are all positive, then NDCG is contained in the range [0, 1] where 1 is the ideal ordering of the recommendation.
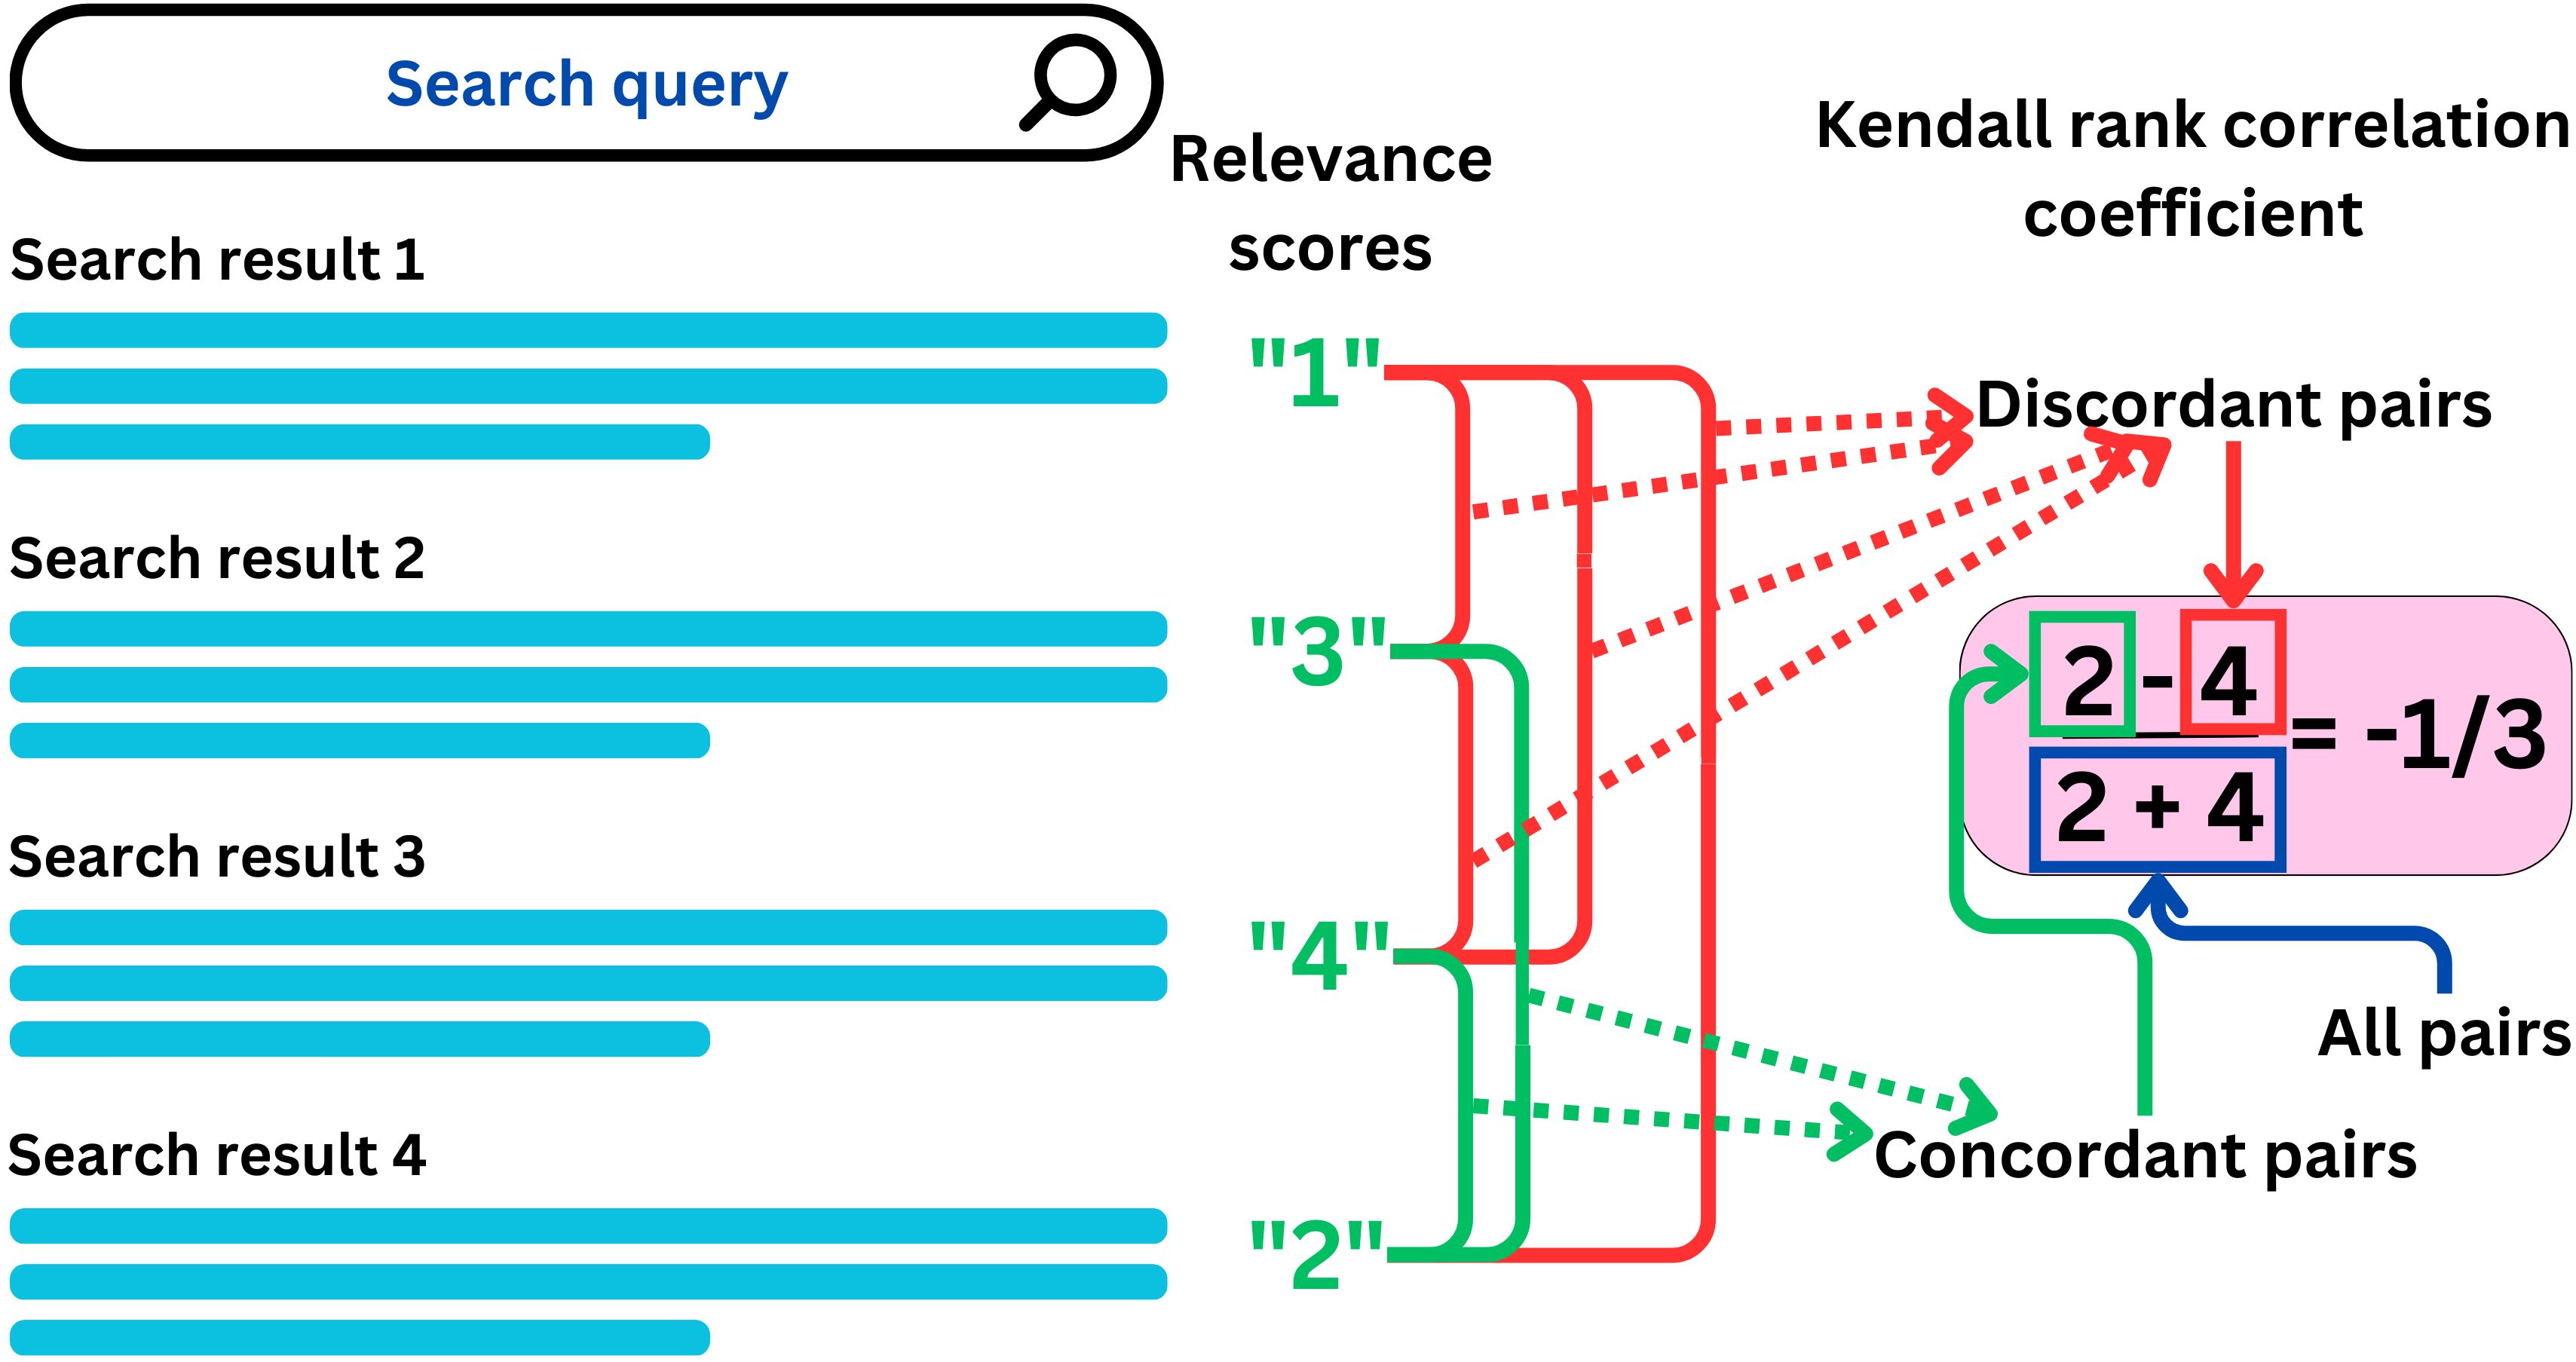
The Kendall rank correlation coefficient
Another way to utilize explicit labels such as relevance measured by human labelers is the use of correlation metrics. The idea is to compare the labels ordering in the recommender system search results to the ideal ordering. The Pearson correlation metric uses the value of the labels but is biased by the specific scale chosen by the labelers. The Spearman correlation considers the rank of the values instead and is more robust to non-linearity in the values. The Kendall rank correlation metric is very similar to the Spearman correlation but it is generally considered more robust to outliers. The idea is to count the number of item pairs that are ordered correctly and the number of item pairs that are ordered incorrectly
However, the Kendall rank correlation metric is more computationally intensive as it requires a O(N2) time complexity.
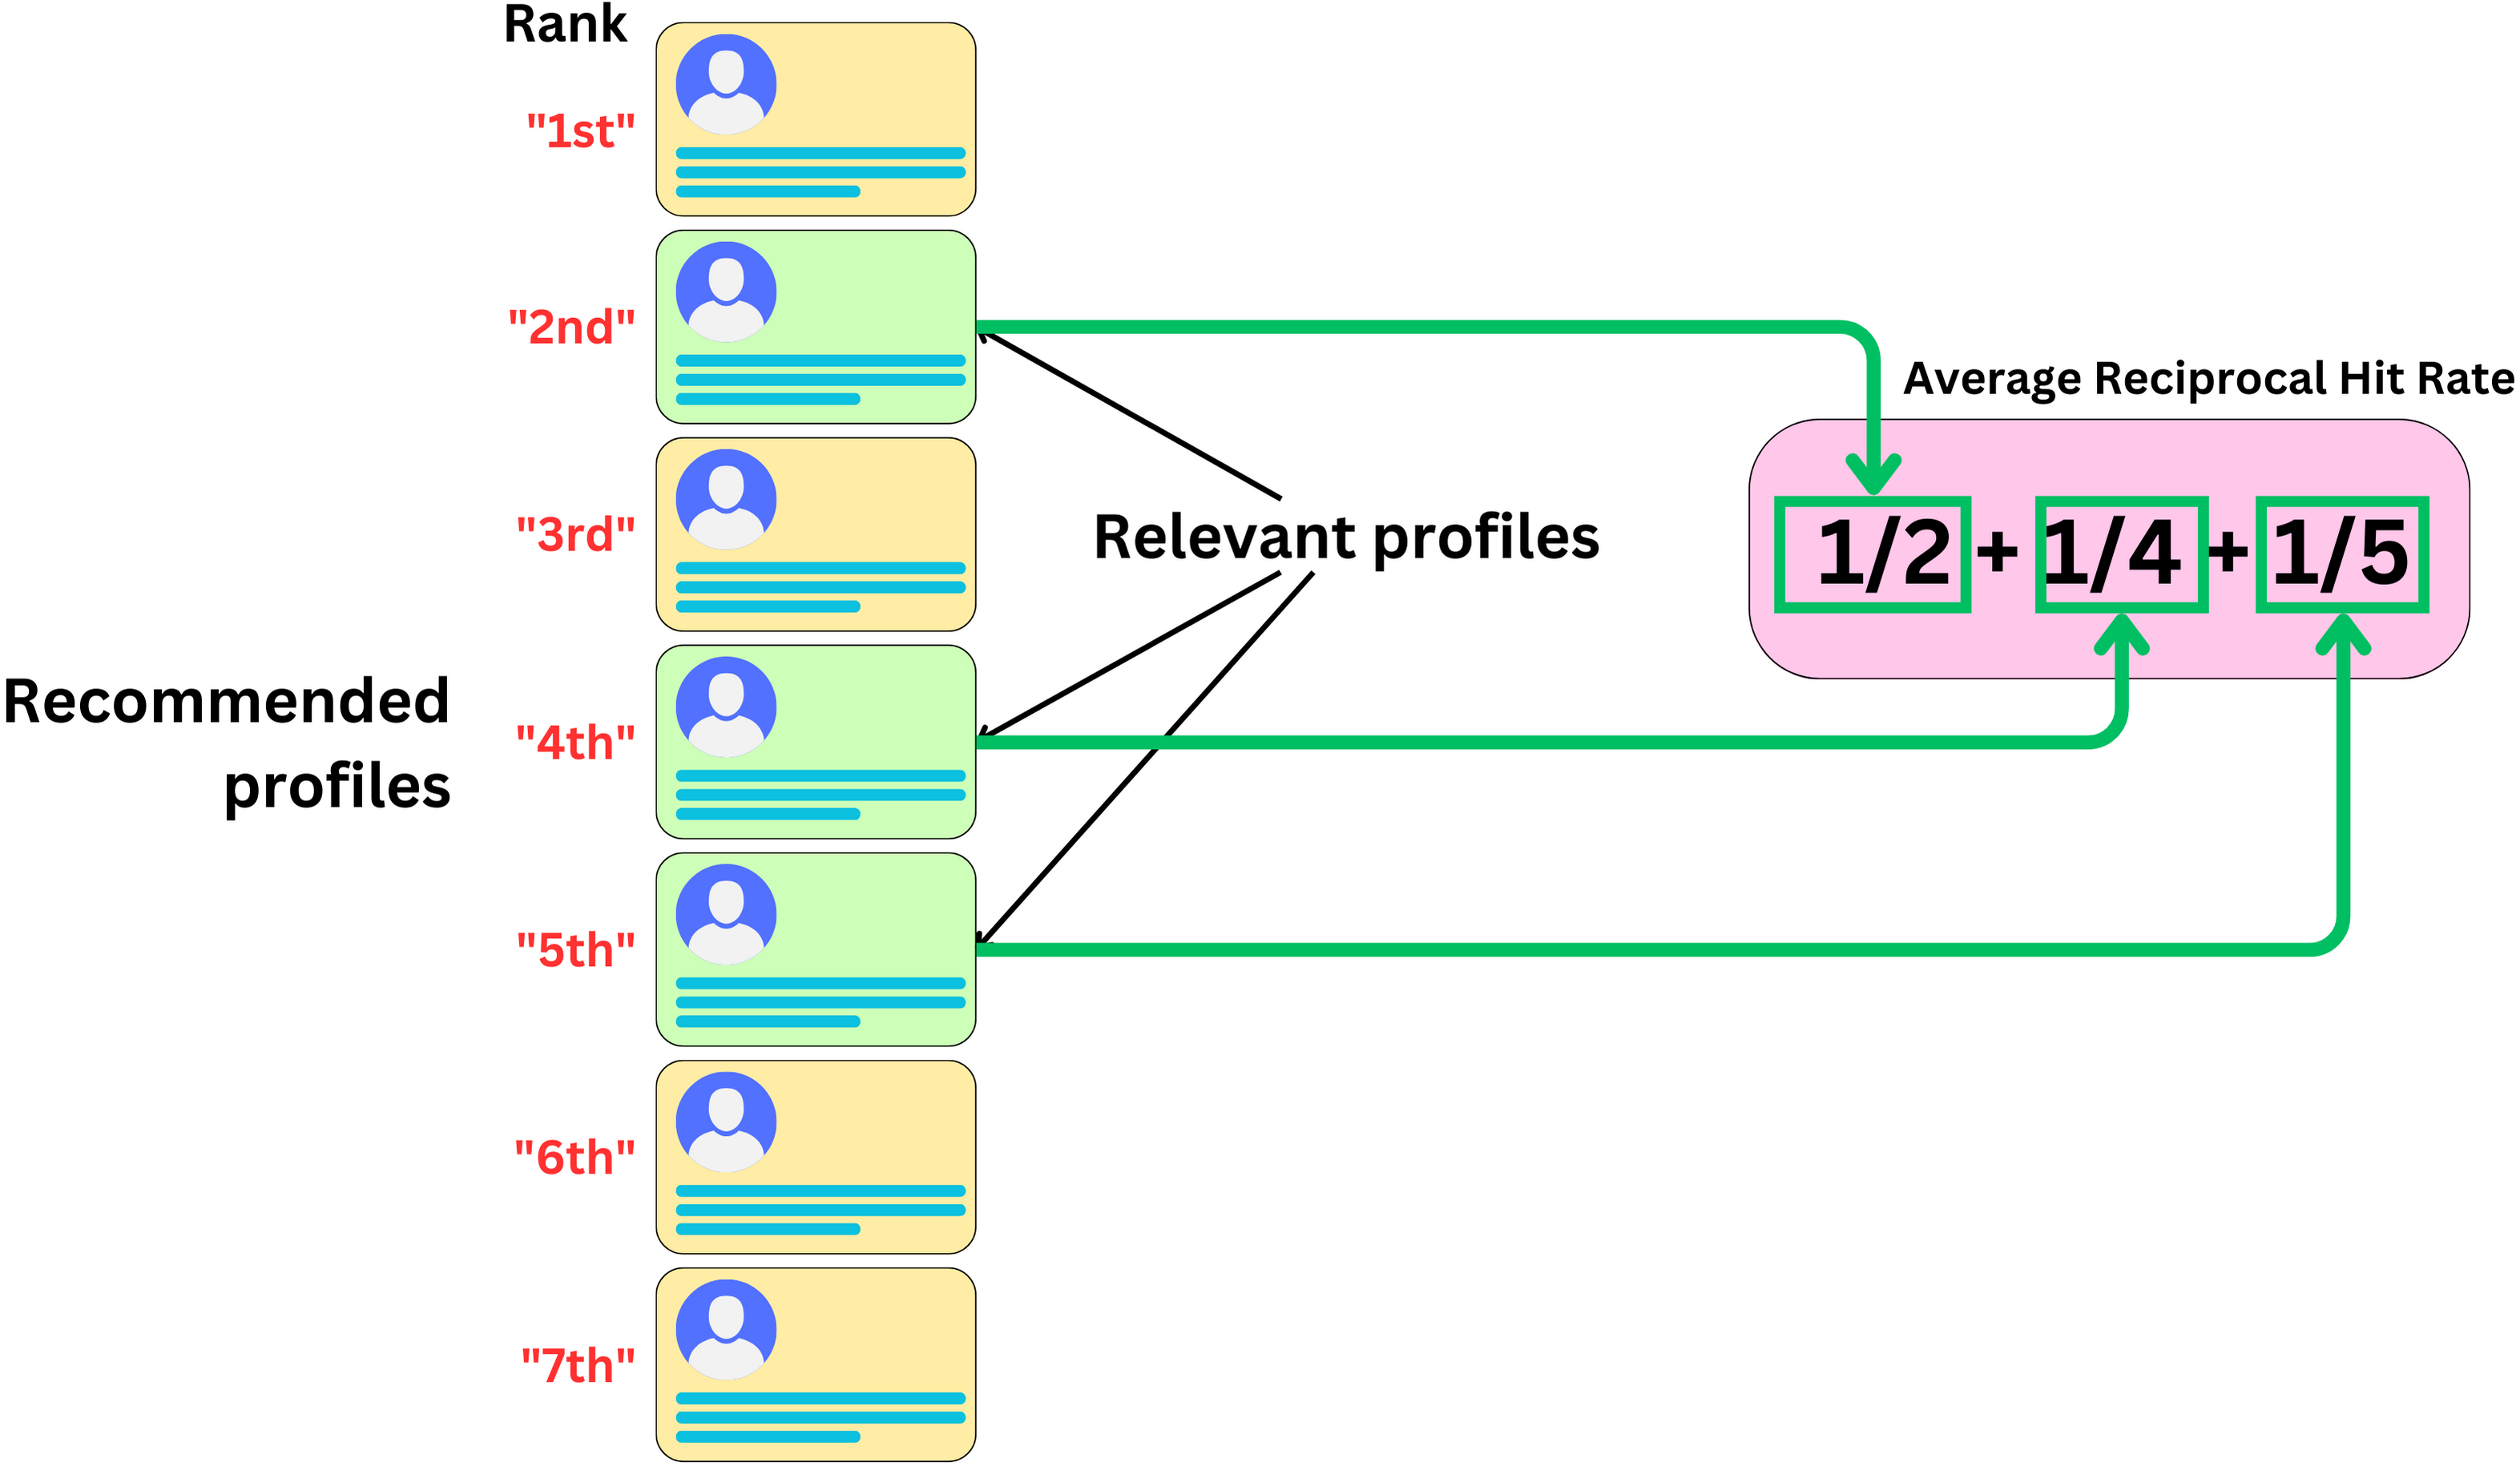
Average Reciprocal Hit Rate
NDCG is a very effective metric if relevance labels are available. If we don’t have those, we need to rely on the implicit “click“ signal we get from the user. For example, consider the Facebook friends suggestion:

I am more likely to click on one of those recommendations if it is presented at the top of the list. As for NDCG, we can use position as a way to measure relevance. The Average Reciprocal Hit rate (also called mean reciprocal rank) answers the question
How many items, discounted by the position, were relevant within the recommended list?
Formally, the reciprocal hit rate (RHR) is defined as
The average reciprocal hit rate is the average reciprocal hit rate across each user the recommender recommended to.
That’s all Folks!
