How To Build An AI Sports Commentator With The Latest GPT-4 Vision and OpenAI Text-to-Speech
Asking questions about an image
Describing videos
Converting the text to speech
Asking questions about an image
Finally, the GPT-4 Vision model is available through the OpenAI API! Many of us may have forgotten that GPT-4 is actually a multi-modal model. It can take text inputs as well as image inputs.
This is mostly so we can ask questions about the image. Let’s play with it! Let’s first make sure we have the right version of the OpenAi Python package:
pip install -U openaiI also set up my OpenAI API key in my environment variables:
import os
os.environ["OPENAI_API_KEY"] = ...
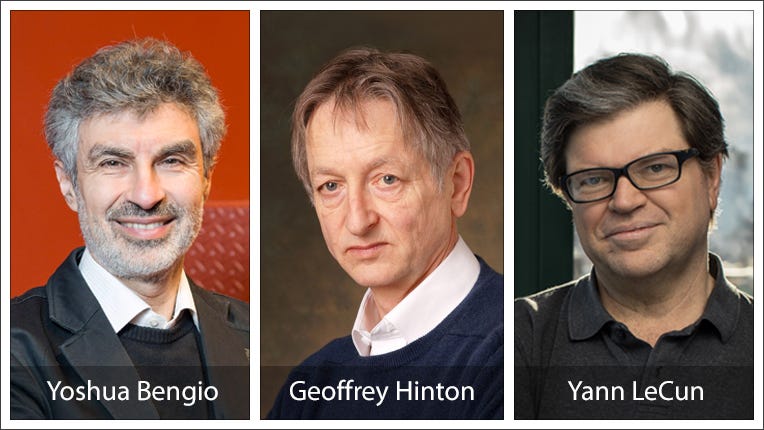
From an URL
I am going to use an image from Google Images at the following URL:
Let’s see if it can describe the image. We use the client.chat.completions.create function:
from openai import OpenAI

client = OpenAI()

prompt = 'Describe the image'
url = 'https://awards.acm.org/binaries/content/gallery/acm/ctas/awards/turing-2018-bengio-hinton-lecun.jpg'

result = client.chat.completions.create(
    model='gpt-4-vision-preview',
    max_tokens=500,
    messages=[{
        'role': 'user',
        'content': [prompt, url]
    }]
)

result.choices[0].message.content
The image features three men standing side by side, each wearing a suit and tie. They are posing for a formal photograph with smiles on their faces. The background is a plain, neutral color. The men are identified as the recipients of the 2018 ACM Turing Award, which is considered to be the "Nobel Prize of Computing." Their names are Bengio, Hinton, and LeCun, and they are recognized for their work in the field of artificial intelligence and deep learning.
Pretty good!
Let’s try something more difficult with the following chart:
prompt = 'What is this chart about?'
url = 'https://www.mongodb.com/docs/charts/images/charts/stacked-bar-chart-reference-small.png'

result = client.chat.completions.create(
    model='gpt-4-vision-preview',
    max_tokens=500,
    messages=[{
        'role': 'user',
        'content': [prompt, url]
    }]
)

result.choices[0].message.content
The chart appears to be a stacked bar chart that represents data in a visual format. It is divided into three different colored segments, which likely represent different categories or variables being measured. The chart has an X-axis with labels (which are not visible in the provided image) and a Y-axis with numerical values, suggesting that the chart is used to compare quantities or frequencies of the categories across different groups or time periods. The exact topic or data represented in the chart is not specified in the image or the provided link.
It doesn’t seem to be able to read the text from the image. Let’s see if it can read with the following image:
prompt = 'What is written?'
url = 'https://thirdspacelearning.com/wp-content/uploads/2021/03/Solving-Equations-What-is.png'

result = client.chat.completions.create(
    model='gpt-4-vision-preview',
    max_tokens=500,
    messages=[{
        'role': 'user',
        'content': [prompt, url]
    }]
)

result.choices[0].message.content


