The AiEdge+: Explainable AI - LIME and SHAP
Machine Learning is not a Blackbox anymore!
Today we dig into 2 powerful techniques for Explainable AI: LIME and SHAP. I think there is a common misconception that interpretability is not possible beyond Linear Regression in Machine Learning. Actually, explainable AI is a very well understood domain for many model paradigms nowadays. We are going to look at:
LIME: for tabular data, text data, image data
SHAP: Kernel SHAP, Linear SHAP, Tree SHAP, Deep SHAP
Additional content about Explainable AI: Github repositories, XAI explained, Youtube videos
LIME
The first time I heard about LIME, I was quite surprised by how recent this technique was (2016)! It is so intuitive that I couldn't believe that nobody really thought about it before. Well, it is easy to be surprised after the facts! It is very reminiscent of Partial Dependence plots or Individual Conditional Expectation (ICE) plots, but instead of looking at the global contributions of the different features, it provides local explanations for each prediction.
LIME (Local Interpretable Model-agnostic Explanations) looks at a ML model as a black box and it is trying to estimate the local variations of a prediction by perturbing the feature values of the specific data instance. The process is as follows:
Choose a data instance
xwith the predictionyyou want to explainSample multiple data points around the initial data point by perturbing the values of the features
Take those new samples, and get the related inferences from our ML model
We now have data points with features
X'and predictionsy'
⇒ Train a simple linear model on those data points and weigh the samples by how far they are from the original data point x in the feature space (low weights for high distance and high weights for low distance).
Linear models are readily interpretable. For example if we have
w1x1 is the contribution to the prediction of the feature X1 for the specific data instance and a high value means a high contribution. So with this linear model we can rank and quantify in an additive manner the contributions of each feature and for each instance to the predictions and this is what we call "explanations" for the predictions.
LIME works a bit differently for different data types:
For tabular data, we can perturb the feature by simply adding some small noise to the continuous variables. For categorical variables, it is more delicate as the concept of distance is more subjective. Another way to do it is to choose another value of the feature from the dataset.
For text data, the features are usually the words or the tokens. The typical way to perturb the features is to remove at random a few words from the original sentence. It is intuitive to think that if we remove an important word, the predictions should change quite a bit.
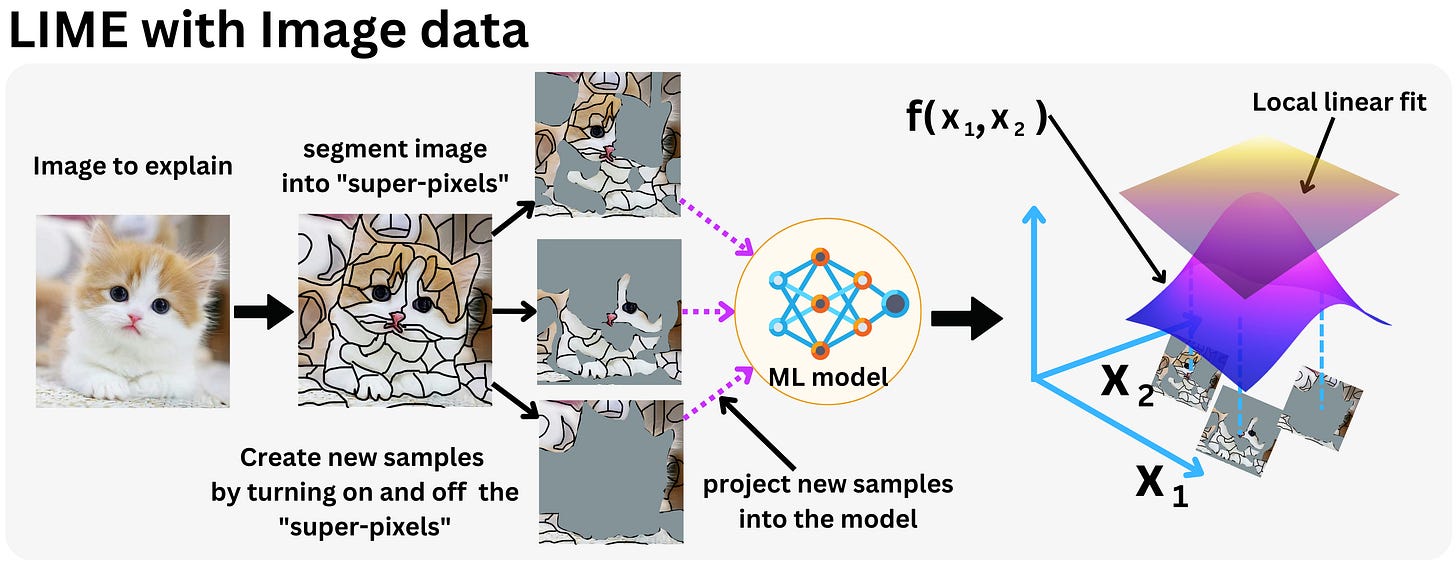
For image data, pixels are not really representative of what "matters" in an image. "Super-pixels" are created by segmenting the image (clustering similar close pixels) and then serve as the main features. We can turn on and off those new features by zeroing their values. By turning off a few super-pixels, we effectively perturb the feature set enough to estimate which segments contribute the most to the predictions.
Here is the original paper: “Why Should I Trust You?” Explaining the Predictions of Any Classifier. The author of the paper wrote his own Python package: lime.
SHAP
SHAP is certainly one of the most used techniques for explainable AI these days but I think most people don't know why. Some researchers had a huge impact on the history of Machine Learning, and most people will never know about them.


