

Advanced Data Manipulation with Pandas
Data Science Fundamentals

Pandas is a very powerful data manipulation library based on the development logic in SQL. We are going to look at:
Group By: split-apply-combine
The Multi-Index
Concatenate
Merge and Join
Reshaping and Pivot Tables

This lecture is part of the Data Science Fundamentals series.
Group By: split-apply-combine
We use again the Titanic data as a toy dataset to demonstrate the different functionalities.
# We load the libraries
import pandas as pd
import seaborn as sns
import numpy as np

# we load the data
titanic_df = sns.load_dataset("titanic")
titanic_df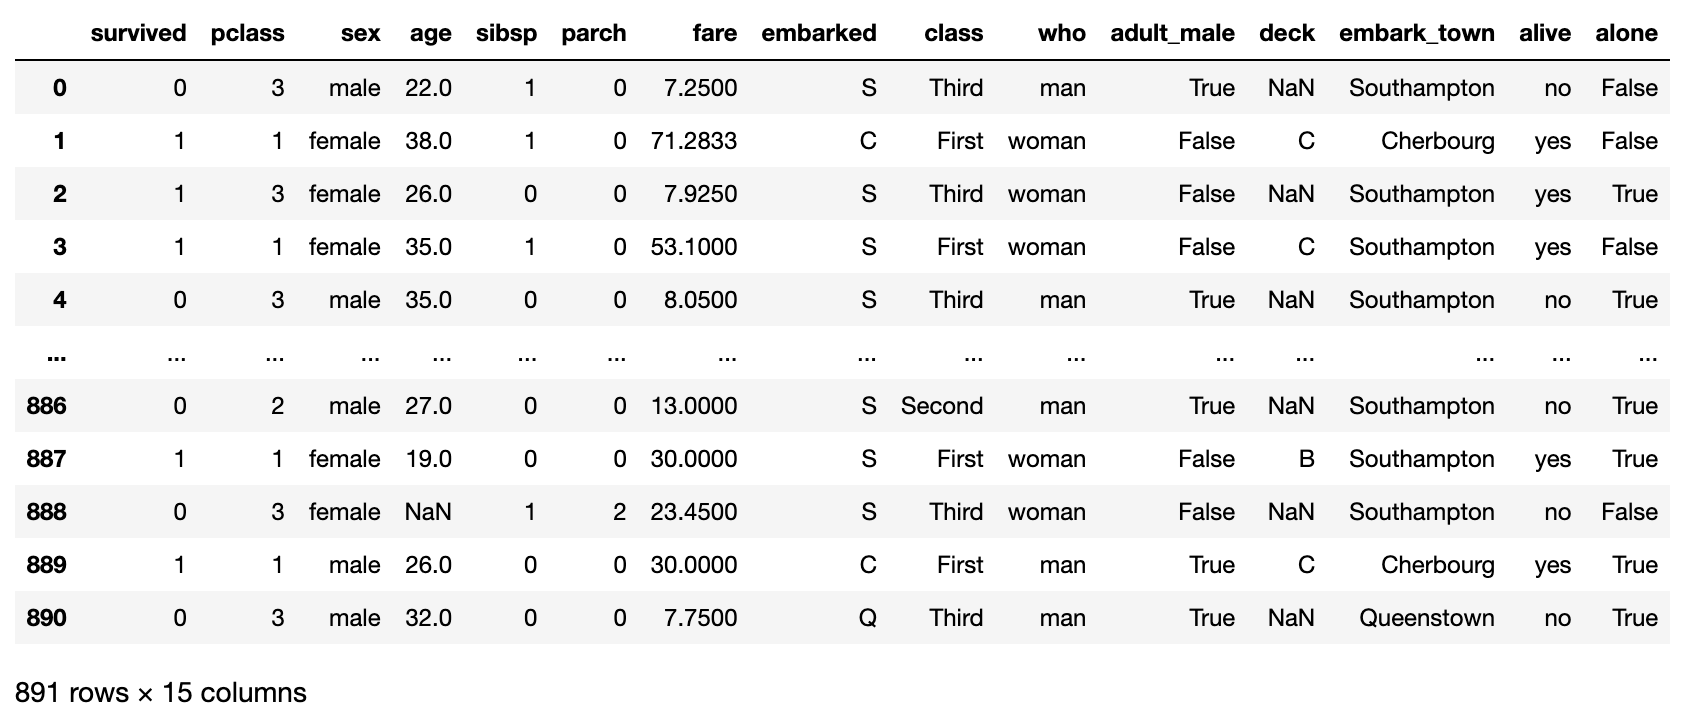
The groupby method works very much like in SQL. We can create a grouped object by columns
grouped = titanic_df.groupby(["survived", "sex"])and we can apply methods on that object. For example we can sum by groups
# We sum by groups
grouped.sum()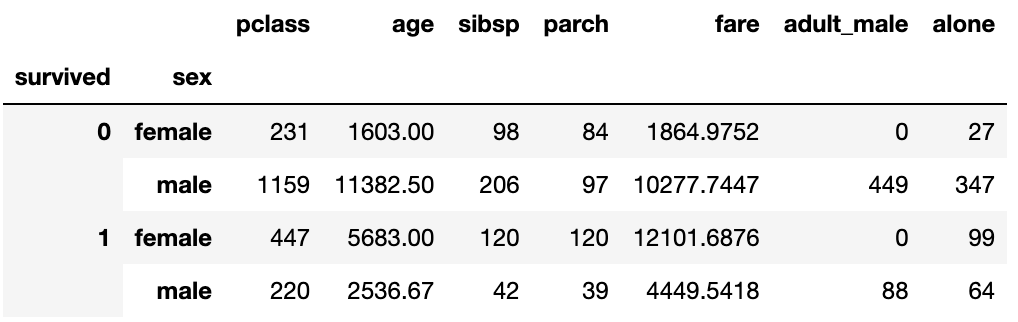
Or we can count by groups
# we count by groups
grouped.count()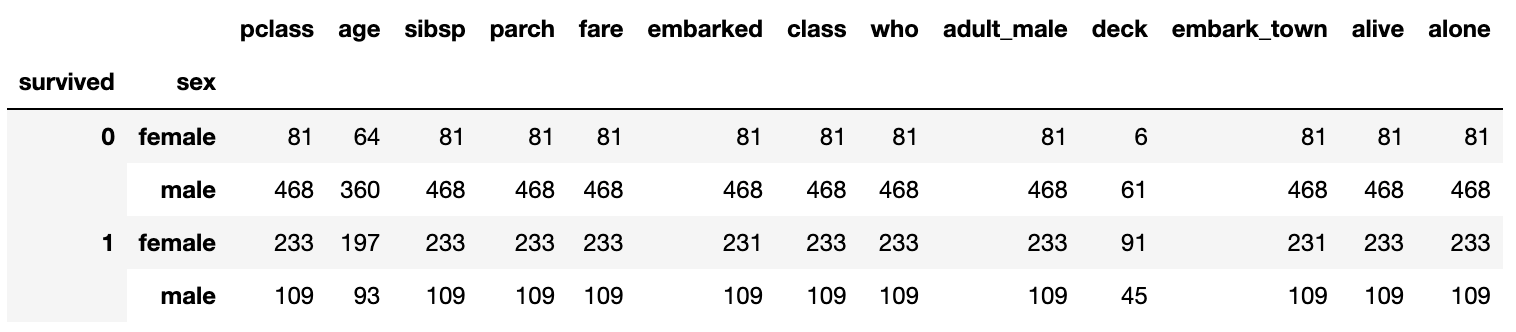
We can look at the first row of each group
# we look at the first row
grouped.first()
We can look at the index of the different groups
grouped.groups
We can also iterate through the different groups
for name, group in grouped:
    print(name)
    print(group)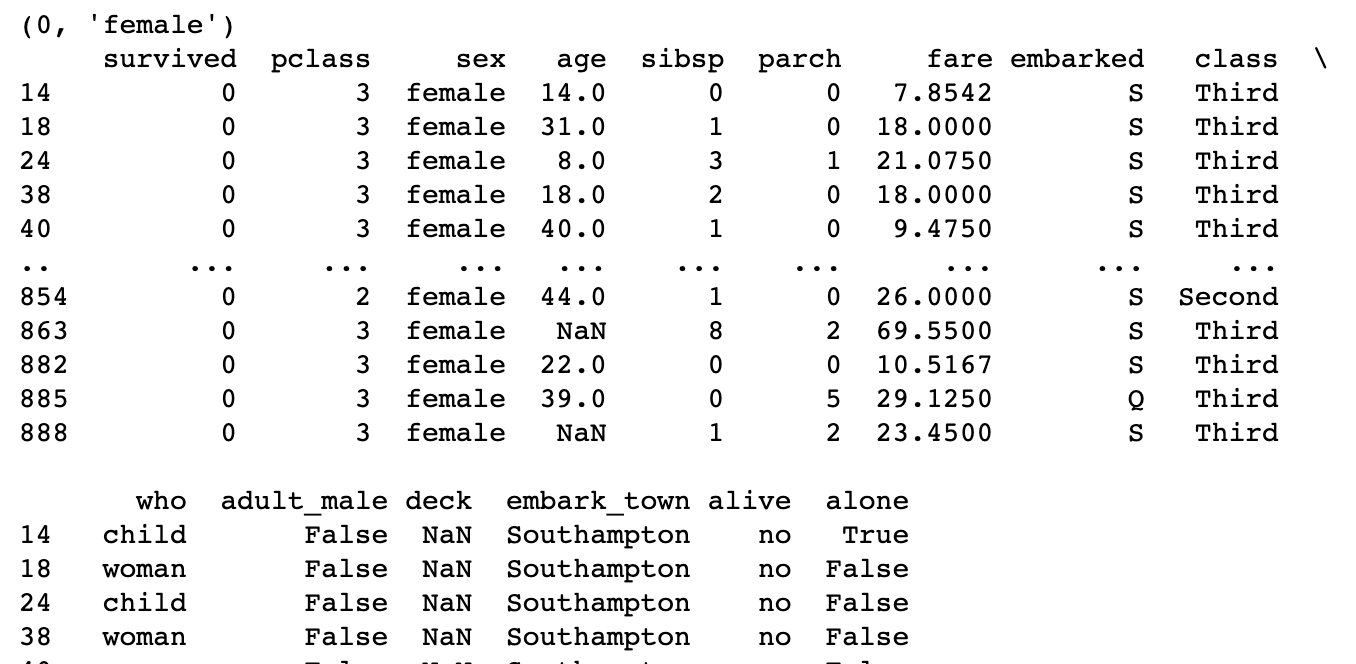
We can use the function agg (or aggregate) to apply function to the groups
# we sum per each group
grouped.agg(np.sum)
Which is equivalent to
grouped.sum()We can apply many functions at once
# we compute the mean and the standard deviation
grouped.agg([np.mean, np.std])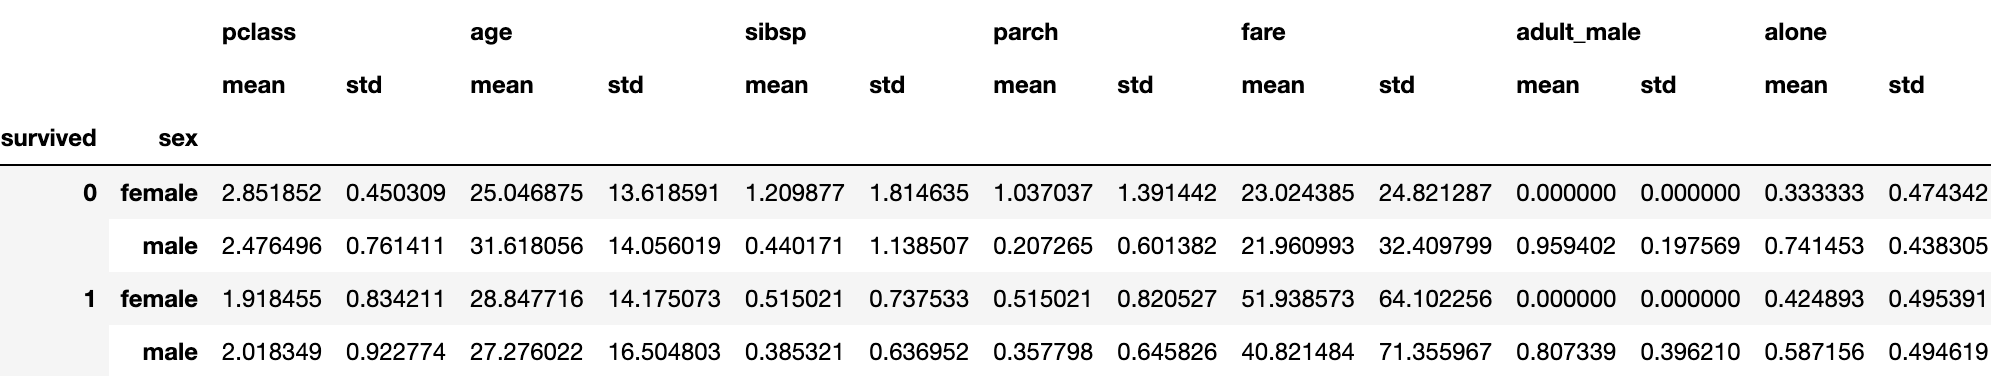
We can use the transform method to transform the different groups
# we construct a function to normalize
normalize = lambda x: (x - x.mean()) / x.std()

# and we apply it to each group
grouped[["pclass", "age", "sibsp"]].transform(normalize)
or equivalently
def normalize(x):
    return (x - x.mean()) / x.std()

grouped[["pclass", "age", "sibsp"]].transform(normalize)
The function apply can be used for more general use cases
# we can apply any function to each group
grouped[["pclass", "age", "sibsp"]].apply(lambda x: x.mean())
We can also plot by groups (which is kind of cool!)
grouped.plot()


The Multi-Index
The multi-index is one of most exciting perks of Pandas. It is often very useful to index the data with the existing columns. Here we create a multi-index
