

Scrapping the Web for NLP applications
Deep Dive in Data Science Fundamentals

We are scrapping text data from Wikipedia to compute the Jaccard similarity metrics between Wikipedia pages and infer a simple classification of those pages. We use the Physics Nobel Prize laureates pages:
We extract the data from the web
We clean the data
We reshape the data
We compute similarity metrics
We infer classification
This Deep Dive is part of the Data Science Fundamentals series.
Introduction

Nowadays, it is easy to find data anywhere! We are going to scrape the web to extract information about the different Physics Nobel Prize laureates. We can find that list in the first table following the Wikipedia URL: https://en.wikipedia.org/wiki/List_of_Nobel_laureates_in_Physics

We are going to extract and use the text data of each Wikipedia page related to those laureates to build similarity metrics and try to predict what physics they practiced

Preparing the Nobel Laureate data
Getting the data
We are going to get the data of all the Nobel price laureates in Physics from Wikipedia. We can use pd.read_html to directly read the tables from Wikipedia:
import pandas as pd

url = "https://en.wikipedia.org/wiki/List_of_Nobel_laureates_in_Physics"

# we just need to feed the url
nobel_tables = pd.read_html(url)
# we know it is the first table
nobel_df = nobel_tables[0]
nobel_df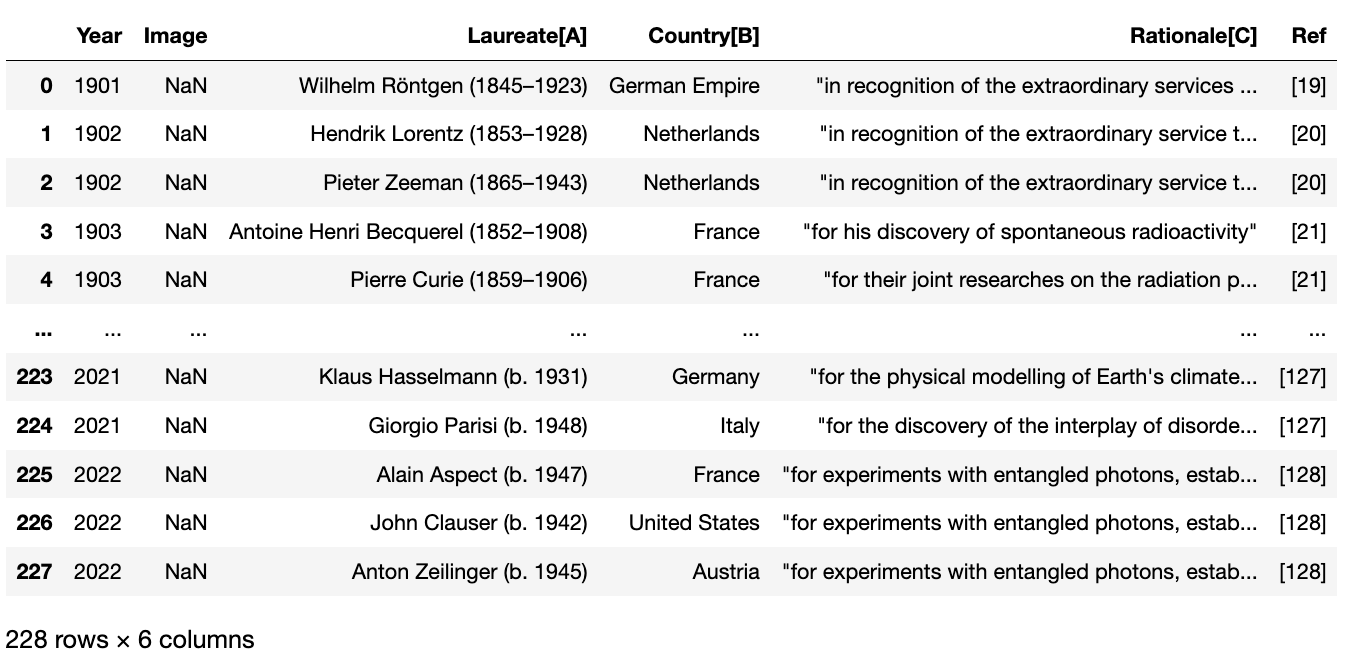
Data cleaning
As you can see the data is a bit messy so we need to clean a bit. We need to:
We are going to clean the columns names by changing them to: "Year", "Laureate", "Country", "Rationale".
We are going remove the rows that where the Nobel price was not awarded.
# drop uncessecary columns
nobel_df.drop(['Image', 'Ref'], axis=1, inplace=True)

# Clean the columns names
nobel_df.columns = ['Year', 'Laureate', 'Country', 'Rationale']

# drop all the rows where the nobel price was not awarded
nobel_df = nobel_df.loc[
    ~nobel_df['Laureate'].str.startswith('Not awarded')
]

# Is the data clean?
nobel_df
Lets check that our data set does not contain missing values
nobel_df.isnull().any()
Some questions about this data
Let's answer few questions about this data.
How many physicists got a Nobel price?
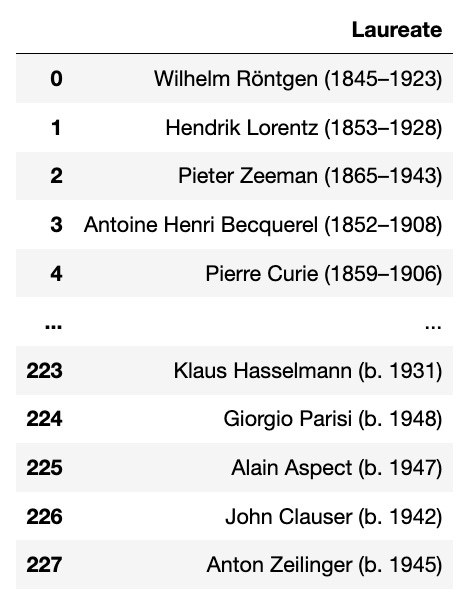
Let’s first remove the dates from the Laureate column
# we remove anything within parenthesis using regex
nobel_df['Laureate'] = nobel_df['Laureate'].str.replace(
    '\(.+?\)', '', regex=True
)

# we remove the unnecessary white spaces
nobel_df['Laureate'] = nobel_df['Laureate'].str.strip()
# we get the unique number of physicists
nobel_df['Laureate'].nunique()
> 221
How many countries are in this data set? Let’s be careful about possible duplicates.
We now need to clean a bit the Country column. Let’s remove the numbers within the square bracket
# we remove anything within square brackets using regex
nobel_df['Country'] = nobel_df['Country'].str.replace(
    '\[.+?\]', '', regex=True
)
Some laureates have multiple countries associated to them. Strangely enough, Wikipedia uses the ascii character “\xa0“ (non-breaking space in Latin1 (ISO 8859-1)) to separate the different countries for the same person
nobel_df['Country'].apply(ascii)
So we can split each row by that character
nobel_df['Country'].str.split('\xa0')
And we can flatten everything into one list
# we flatten everything into a list
sum(nobel_df['Country'].str.split('\xa0').tolist(), [])
And now, we can simply count the number of countries
pd.Series(
    sum(nobel_df['Country'].str.split('\xa0').tolist(), [])
).str.strip().nunique()

> 30
Let's look at the distribution of countries:
We print the countries with the number of time it is contained in the
countriespandas Series. We can use the pd.Series.value_counts function.We plot a barplot ordered by those number. We can use the function pd.plot by changing the argument
kind.
# we create the country variable
countries = pd.Series(
    sum(nobel_df['Country'].str.split('\xa0').tolist(), [])
).str.strip()

# and look at the counts
countries.value_counts()
And we can plot
countries.value_counts().plot.bar()
United States is far in the lead when it comes to the number of Nobel prizes!
Getting the text data
Let's gather the text data associated to each of those physicists. Ultimately we want to extract the words that are characteristics of each physicist.
We are going to extract the webpage links to have access to their bibliography. I am using the httplib2 and bs4 libraries. Let’s download them
pip install httplib2
pip install bs4
Let’s find all the tables in html format
from httplib2 import Http
from bs4 import BeautifulSoup, SoupStrainer

url = 'https://en.wikipedia.org/wiki/List_of_Nobel_laureates_in_Physics'

# we pull the html code from the url
http = Http()
status, response = http.request(url)

# and extract only the tables
table = BeautifulSoup(
    response,
    'lxml',
    parse_only=SoupStrainer('table')
)

table
We can now extract all the “href“ from the “a“ object. This gives us a map of the names and their Wikipedia URL links
